Episode 2‑4: The “100% Self‑Consumption Barrier” Revealed by One Year of Data
In the previous article, I touched on the possibility of achieving 100% self‑consumption.
Here, I take a closer look at the full year of data from 2025. Reviewing the numbers made it even clearer how much solar + battery can transform daily life.
—
2025 Results (February–December)
February (20 days)
- Generation: 440 kWh
- Self‑consumption rate: 96%
- Purchased electricity: 12.2 kWh
- Electricity sold: 122.2 kWh
March
- Generation: 637 kWh
- Self‑consumption rate: 91%
- Purchased electricity: 34.2 kWh
- Electricity sold: 238.7 kWh
April
- Generation: 754 kWh
- Self‑consumption rate: 93%
- Purchased electricity: 19.3 kWh
- Electricity sold: 385.6 kWh
May
- Generation: 698 kWh
- Self‑consumption rate: 98%
- Purchased electricity: 2.8 kWh
- Electricity sold: 350.2 kWh
June
- Generation: 785 kWh
- Self‑consumption rate: 97%
- Purchased electricity: 9.8 kWh
- Electricity sold: 347.9 kWh
July
- Generation: 908 kWh
- Self‑consumption rate: 99%
- Purchased electricity: 0.7 kWh
- Electricity sold: 343.8 kWh
August
- Generation: 824 kWh
- Self‑consumption rate: 94%
- Purchased electricity: 23.1 kWh
- Electricity sold: 316.3 kWh
September
- Generation: 633 kWh
- Self‑consumption rate: 94%
- Purchased electricity: 22.9 kWh
- Electricity sold: 195.2 kWh
October
- Generation: 394 kWh
- Self‑consumption rate: 89%
- Purchased electricity: 34.9 kWh
- Electricity sold: 93.6 kWh
November
- Generation: 456 kWh
- Self‑consumption rate: 92%
- Purchased electricity: 22.8 kWh
- Electricity sold: 104 kWh
December
- Generation: 431 kWh
- Self‑consumption rate: 78%
- Purchased electricity: 93.8 kWh
- Electricity sold: 62.9 kWh
—
What the Data Revealed
1. Except for December, every month had “more electricity sold than purchased.”
This shows that even a typical household can approach energy independence with a solar + battery setup.
July’s 99% self‑consumption rate was especially remarkable.
—
2. Why purchased electricity still occurs—even in months with high generation
Even in months like October and November, where surplus electricity was sold, some grid power was still needed.
The reason is simple: battery capacity limits.
When weather is poor and daytime generation drops, the 13.5 kWh Tesla Powerwall cannot fully cover consumption at certain moments.
—
3. December’s challenge: “insufficient generation” + “heating load”
In my home, December’s generation was almost equal to our consumption.
In other words, there simply wasn’t enough sunlight.
On top of that, winter heating significantly increases electricity use.
I also learned that the insulation performance of our early‑2000s home—while meeting the standards of its time—is two to three levels below modern insulation standards, and this directly impacts winter electricity demand.
—
4. Clear directions for improvement
- Summer: Plenty of generation → How to secure enough storage for rainy days
- Winter: Insufficient generation → How to reduce consumption (insulation is key)
These two challenges form the core of the journey toward achieving 100% self‑consumption.
—
Next Episodes
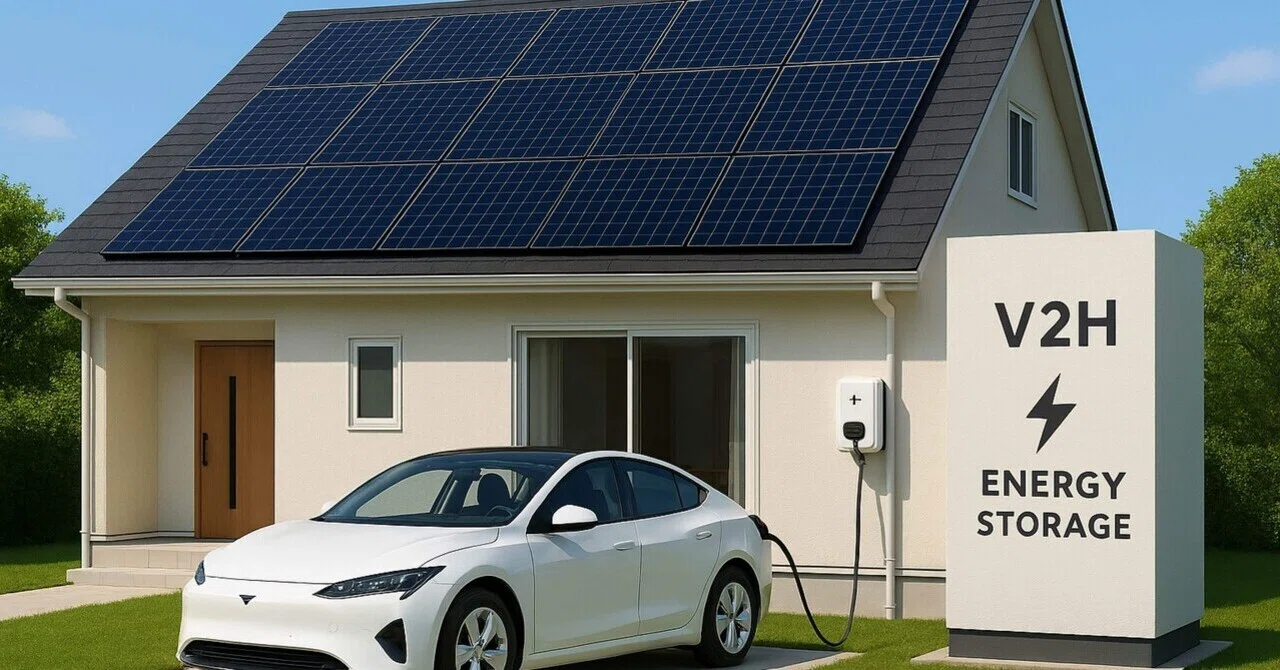
Episode 3: V2H installation as a strategy for expanding storage capacity
Episode 4: A practical demonstration of improving home insulation
コメント